Published: 2022-12-12 ǀ Updated: 2023-06-02
Fashion Statistics 2022/3

As the seventh-largest sector of the economy, the fashion industry generates a significant share of global sales and employs thousands of people. In the past two years, the industry has not been spared the effects of the Corona pandemic—although in many areas it has already returned to or even exceeded the level seen before the outbreak.
What is the fashion industry?—A definition
A definition of which sectors belong to the fashion industry is by no means simple. After all, fashion includes not only clothing, but also accessories and shoes. It makes no difference, whether the products are designed for men, women or children.
The choice of materials, from pure cotton to artificial polyester, also plays no role in the classification as fashion, nor does the question of luxury items or inexpensive fast fashion. It is more difficult with functional sportswear, workwear or outdoor fashion.
The following statistics therefore differentiate the global fashion market in general from the individual segments of men's, women's and children's clothing, shoes or accessories. In addition, there are exciting figures on luxury fashion and fast fashion, global supply chains, and the megatrends of sustainability and digitalization, which have long since arrived in the fashion industry.
Global fashion industry facts

Fashion statistics include footwear, apparel and accessories. Statistics habe been collected from English and German sources.
The global fashion industry produces more than 100-150 billion individual parts—per year. Around 80 billion parts of these are purchased every year.

At $1,460, per capita spending on clothing and footwear in the USA is the highest in the world. By comparison, in Brazil, a person spends an average of around $100 per year.
Annual consumption of garments is 183.81 trillion pieces in 2022. By 2026, 197.32 trillion. garments are forecast worldwide.
Consumer behavior differs significantly by country:
| Country | avg. Val. / Items | avg. Items / Person | avg. Val. / Item |
|---|---|---|---|
| USA | $844 | 53 | $16.04 |
| UK | $889 | 33 | $27.33 |
| Brasilien | $117 | 11 | $10.49 |
| Norwegen | $1150 | 12 | $28.26 |
| Ägypten | $27 | 2 | $12.63 |
| Indien | $34 | 5 | $7.01 |
| China | $198 | 30 | $6.73 |
| Vietnam | $24 | 2 | $9.81 |
| Japan | $547 | 26 | $20.9 |
After slumps in sales figures during the Corona pandemic in 2020, the womenswear market grew the most between May 2021 and 2022, by 28.9%. Overall, there was an increase of 18.8 %.
The most important import country for apparel worldwide is the USA with a volume of $12.42 billion. Germany follows in 2nd place with 38.43 billion USD.
With an export value of 154.15 billion USD, China is the most important export country for textiles worldwide (2020). India is in second place with one-tenth of the export volume ($15.04 billion).
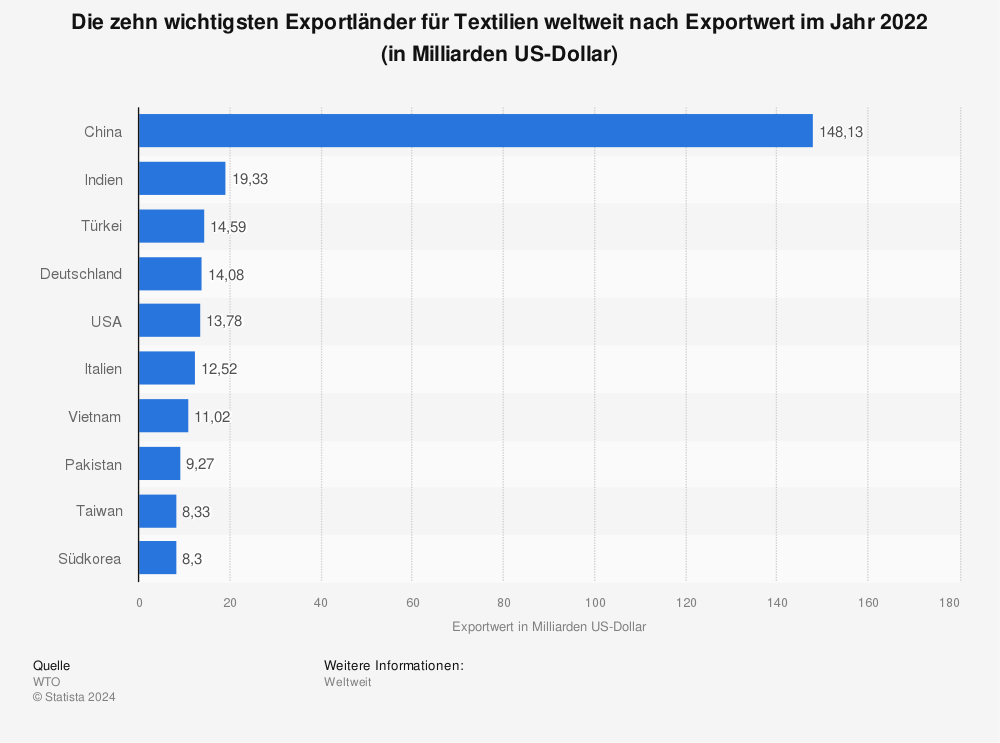

France is the world's most important fashion market—with more than 2,300 index points, ahead of Italy (1,866 points) and the USA (697 points). Taken into account: the relative market strength of all fashion brands in a country, their effective market value, industry influence, prestige value, marketing activity, performance in their own price segment.
84% of consumers are interested in personalizing products and are prepared to pay more for this. The desire for individualized color and customized clothing is particularly high (45%). Also on the wish list are personalized everyday clothing (41%), seasonal fashion items (31%) and personalization of high-fashion highlights (26%).
Fashion brands around the world

The world's best-known fashion brands include luxury brands as well as well-known brands such as Adidas or Nike, but also fast fashion companies such as H&M. Not all companies with strong sales are known worldwide.
With a brand value of $13.2 billion, Nike is the most valuable apparel brand worldwide. Second place goes to Louis Vuitton ($13.4 billion), followed by Gucci ($18.1 billion). Other sources put Nike's brand value at $109.6 billion. If luxury brands are not taken into account, Zara ($154, billion) and Adidas ($13.79 billion) rank second and third in terms of the highest brand values of the leading apparel brands.
Measured by sales between April 2021 and April 2022, TJX Cos has been even more successful than Nike ($46.89 billion) and Inditex ($32.57 billion) globally recently, with $48.55 billion.
In terms of stock market value, LVMH is the world's most successful clothing company.
| Rank | Company | Marketcap in Bn. USD |
|---|---|---|
| 1 | LVMH | 322.13 |
| 2 | Nike | 141.43 |
| 3 | Dior | 111.90 |
| 4 | TJX Companies | 82.66 |
| 5 | Inditex | 71.48 |
| 6 | Fast Retailing | 57.07 |
| 7 | lululemon athletica | 40.55 |
| 8 | Ross Stores | 32.03 |
| 9 | Adidas | 17.38 |
| 10 | H&M | 17.16 |
While Nike's brand value increased year-over-year, ranking it only sixth among apparel brands, Louis Vuitton increased its brand value by 58% and Fila by 34%.
The biggest losses in brand value 2021-2022
| Brand | Loss % |
|---|---|
| Uniqlo | -26 |
| Next | -12 |
| Primark | -10 |
| The North Face | -7 |
| Victorias Secret | -3 |
| Bulgari | -3 |
| Omega | -2 |
| Zara | -1 |
Top 10 most valuable fashion brands:
| Brand | Value / Bn. $ | Change |
|---|---|---|
| Nike | 33.2 | +9 % |
| Louis Vuitton | 23.4 | +58 % |
| Gucci | 18.1 | +16 % |
| Chanel | 15.3 | +15 % |
| Adidas | 14.6 | +2 % |
| Hermès | 13.5 | +16 % |
| Zara | 13 | -1 % |
| H&M | 12.7 | +3 % |
| Cartier | 12.4 | +3 % |
| Uniqlo | 9.6 | +26 % |
The highest retail profits in fiscal year 2021:
| Brand | in Bn. € |
|---|---|
| Inditex | 27.72 |
| H&M | 18.50 |
| GAP | 15.54 |
The fashion brands with the greatest growth in brand value 2021-2022:
| Brand | Increase |
|---|---|
| Li-Ning | 68 % |
| Skechers | 68 % |
| Louis Vuitton | 58 % |
| Boss | 54 % |
| Van Cleef & Arpels | 37 % |
| Tag Heuer | 35 % |
| Fila | 34 % |
| YSL | 34 % |
| Moncler | 32 % |
| Celine | 29 % |
Fashion magazines

The most influential fashion magazine in the world is Vogue with its Italian edition, followed by Paris Vogue. Places 3 and 4 are also occupied by the well-known fashion magazine (UK and USA editions), before the French ed. of Elle follows in 5th place.
Fashion magazines as a source of information on luxury fashion are particularly popular in the United Kingdom (73 %).
Fashion by segments—Apparel

Clothing accounts for by far the largest sales in the fashion sector worldwide. One reason to take a closer look at this submarket.
Globally, the apparel market generates 1.7% of the world's GDP with an estimated value of 1.5 trillion. USD (2021). At the same time, the apparel industry is responsible for 8.8% of global CO2 emissions—more than international aviation and maritime shipping combined. Growth is expected to be 4.8% per year through 2026, meaning that the apparel market will grow by a total of 26% by 2026, with CO2 equivalents increasing by 15%.
Global apparel market revenues were $1.58 trillion in 2019, but fell to $1.4 trillion during the Corona pandemic. USD. In 2022, they have surpassed pre-Corona levels at 1.71 trillion USD and continue to grow.
The Asian apparel market generates the highest revenues (38.8%), followed by Europe (28.6%) and the Americas (27.6%). By 2025, China is expected to be the world's single largest market (19.4%) in this segment.
| Region | Market share |
|---|---|
| Asia | 38,8% |
| Europe | 28,6% |
| Amerikas | 19,4% |
The sales share of luxury clothing is 5 %. Second-hand clothing accounts for 5.5%. Only 4.3% of sales are generated by the sale of sustainable clothing.

The largest importer of apparel is the EU with 24.3%, and the largest exporter is China with 31.6% of the world share.
The USA is (still) the largest single market in the world in 2022. China follows closely in 2nd place, well ahead of India, Japan and the UK.
In 2022, each person worldwide will buy an average of €179.50 worth of clothing—22.01 pieces. Around 35% of this is spent online.
The world's largest apparel manufacturer and retailer is Spain's Inditex, with sales of $31.01 billion, ahead of H&M ($20.83 billion) and Fast Retailing ($18.45 billion).
| Company | Sales / Bn. $ |
|---|---|
| Inditex | 31.01 |
| H&M | 20.83 |
| Fast Retailiing | 18.45 |
In 2020, Hong Kong had the highest per capita spending at $1,498. Globally, this is likely to increase most in China by 2026—from $180 to $157, or by 6.1%.
The average price for an item of clothing is highest for men's clothing at €12.32 and lowest for children's clothing at €3.48. Women's clothing costs an average of €12.32 per item.

Brand awareness is particularly high when it comes to clothing: 47% of U.S. consumers, 48% of Chinese and 32% of buyers in the United Kingdom attach importance to the brand when buying clothing.
The menswear market has the greatest growth potential of 44% between 2020 and 2026.
Menswear

At €89.83 billion, the United States represents the largest market, ahead of China (€83.02 billion) and India (€25.31 billion).
| Country | Sales / Bn. € |
|---|---|
| USA | 89.83 |
| China | 83.02 |
| India | 25.31 |

At 65.4%, almost two-thirds of sales will be made offline in 2022. In terms of online sales, sales via mobile devices are ahead of desktop devices at 59.1 %.
Average per capita consumption in 2022 is around 4.87 units, or €58.69 per capita (based on population size).
Luxembourgers ($428.5) and Icelanders (€412) spend the most per capita on menswear.
The share of sales accounted for by sustainable apparel is expected to rise from 3.7% in 2022 to 5.3% in 2026.
Menswear sales worldwide will be around €446.80 trillion in 2022. Annual growth of 4.5% to €532.90 trn. is expected up to 2026. Then the forecast market volume in terms of volume will be over 43 Bn. pcs.
Women's clothing

Average per capita consumption in 2022 is around 8.98 units, or €92.89 per capita (based on population size).
Women in Luxembourg, Switzerland and Norway spent the most on women's clothing. Per capita spending here in 2020 was $136.5, $134.1 and $126.6, respectively.
The largest market, at €145.80 trillion, is the USA, ahead of China (€138.40 trillion) and Japan (€37.62 trillion).
| Country | Sales / Bn. € |
|---|---|
| USA | 145.80 |
| China | 138.40 |
| Japan | 37.62 |

The share of sales for sustainable apparel is expected to rise from 4.5% in 2022 to 6.4% in 2026.
At 63.9%, almost two-thirds of sales will be made offline in 2022. In terms of online sales, sales via mobile devices are ahead of desktop devices at 58.5%.
Global sales of women's apparel will be around €707.10 Bn. in 2022. Annual growth of 4.47% to €842.30 trn. is expected up to 2026. Then the forecast market volume in terms of volume will be 79.01 Bn. pcs.
Children's clothing

Sales of children's apparel are € 212.60 Bn. worldwide (2022). This volume could reach €246 Bn. by 2026—70.19 Bn. Pcs, i.e. 3.72% annually. The largest market for children's clothing is in the USA.
Converted to the size of the population, the annual sales per capita are €27.93 or 8.16 units.
In 2022, 32.5% of sales will be generated online, with 57.9% via mobile devices. By 2026, the online share of sales will probably rise to 40.5%.

The largest single markets for children's clothing worldwide are the USA, China, India, Uk and Japan.
The global footwear market

After apparel, shoes represent the segment with the highest sales in the fashion industry.
Per-unit spending is highest for athletic shoes at €103.40 and lowest for fabric shoes and other footwear at €13.17.
Converted to the population, per capita sales are €44.85 / capita or 1.89 pairs in 2022, with people most often owning fabric shoes & other shoes, and least often sports shoes.
In 2022, the market revenue for footwear worldwide will be around € 341.50 Bn. By 2027, annual growth of 4.88% is expected to reach a volume of €433.30 Bn—17.32 Bn. pc. The largest market segment is for fabric shoes & other footwear (€119.40 Bn. in 2022) followed by leather shoes (€111.50 Bn. in 2022).

Luxury Fashion and Casual Wear
Everyday wear, sporty casual wear or elegant evening wear. All are subsectors of the global fashion industry.
Casual Wear

Casual wear refers to a casual clothing style that is predominantly worn in leisure time, but is less common in everyday office life.
In the casual wear fashion brands, Burlington Stores has the highest stock market value, followed by Levi Strauss and Gildan Activewear.
In terms of sales, The GAP is the most successful company with 16.16 Bn. USD sales, ahead of Burlington (9.05 Bn. USD) and Hanesbrands (6.87 Bn. USD).
| Brand | Sales / Bn. $ |
|---|---|
| The GAP | 16.16 |
| Burlington | 9.05 |
| Hanesbrands | 6.87 |

The denim jeans market is currently in a constant growth phase, increasing from currently 64.5 Bn. USD to approx. 87.4 Bn. USD in 2027.
For the period starting June 2022, the sales growth of the leading apparel, footwear and accessories companies at Delta Apparel and Duluth Holdings is likely to be 10.4% each.
Luxury fashion

Which products actually count as luxury goods is not clearly defined. They are generally regarded as expensive, high-quality, and their possession is associated with a certain social status. From a marketing perspective, exclusivity and aura are indispensable components for a luxury brand.
Sales of luxury fashion will reach €86.93bn in 2022. The segment will presumably continue to grow by around 4.61% in the coming years. At 20.6%, the share of online sales will be low compared with other segments.
Between 2022 and 2031, the luxury fashion market is forecast to grow at an annual rate of 11.1% to reach a volume of 278.18 Bn. USD.

After a short-lived decline in 2020 (revenue of $14 trn), the luxury apparel market continued to grow in 2021 ($108.4 trn) compared to 2019 ($103.99 trn) and could also increase in 2022 ($117.15 trn).
The largest individual markets worldwide in 2022 are the USA, ahead of China, Japan, Italy and the UK.
Fashion has the largest market share among luxury goods in Germany (80%), followed by Italy (64%). Cosmetics and fragrances dominate in Japan (50%), and watches and jewelry in China (88%).
Luxury fashion brands represent the smallest companies on average among luxury brands, with sales of 1.2 Bn. USD (2019). By comparison, multiple luxury brand suppliers turn over an average of 9.59 Bn. Euros in sales. These brands are also growing significantly faster and generating higher net profits.
PVH Group is the only company in the top 10 luxury brands that focuses on selling fashion. Overall, the luxury fashion segment accounts for 37% of companies and 16% of sales (2019). They thus represent the most companies among the top 100 brands.
Based on sales figures, LVMH is the world's most successful luxury brand, ahead of Kering SA and Estee Lauder. At 51.2%, the ten largest luxury brands generate more than half of the sales of the top 100 brands in this sector and 71.7% of net profits.
Among luxury brands, Chanel is regarded as sustainable by 18%, and as a luxury fashion leader in sustainability by a further 30%. This puts the company ahead of Hermès and Dior.
The luxury brand that enjoys the greatest trust worldwide is Hermès —followed by Chanel and Louis Vuitton in second and third place.
Sports inspired clothing

The boundary between sportswear and leisurewear is fluid. Garments are often no longer worn exclusively for training, but also in everyday life, so this segment is enjoying growing popularity. This does not include functional sportswear and swimwear.
The largest markets for sports-inspired apparel in the men's segment are the USA, followed by China and Germany. In the women's segment, Japan is the third largest market for sports-inspired apparel after the USA and China.
Global unit sales are forecast to increase between 2022 and 2026 from 930 million units to 1.21 Bn. units for men, from 1.38 Bn. to 1.74 Bn. units for women. This means a per capita volume of 0.12 and 0.15 units respectively for men (0.18 and 0.22 for women).
For men, global sales in 2022 will be €21.28 Bn. and for women €31.42 Bn. The forecast is for growth to around €28.22 trillion (men) and €41.32 trillion (women).

According to the forecast, the share of sales accounted for by sustainable sportswear will increase from the current 3.9% to 5.6% for men and from 4.7% to 6.8% for women.
Offline retail sales are expected to decrease from 64.4% to 53.8% for men's athletic apparel between 2021 and 2026. For women, offline purchases will fall from 60.7 to 51.8 %. At the same time, the share of mobile devices among online purchases will increase by around ten percent over the same period, from 60.2% to 70.3% for men and 59.3% to 66.4% for women.
Sales and Distribution Channels

Retail, fast fashion chain or purchase via the company's website, Amazon or other online stores—all are possible sales channels for fashion. In addition, for some years now, there has been the business model of second-hand clothing.
The sales channel changed and is changing permanently:
| Channel | 2011 | 2021 | 2031 |
|---|---|---|---|
| Second Hand | 4% | 9% | 18% |
| Rental | 1% | 4% | 5% |
| Amazon Fashion | 0% | 4% | 5% |
| Off-Price | 11% | 17% | 19% |
| Direct to Consumer | 4% | 11% | 12% |
| Fast Fashion | 7% | 8% | 8% |
| Mid-Prices Specialty | 25% | 16% | 13% |
| Value Chains | 12% | 13% | 10% |
| Department Stores | 21% | 10% | 6% |
| Other Retailers | 15% | 11% | 8% |
Digitalization is perceived as the biggest opportunity for the fashion industry (32%), followed by sustainability (12%) and consumer involvement (11%).
The effects of global trade are not stopping at the fashion industry: 67% of retailers expect price increases in 2023. On average, 3.2% price increases are expected.
Mc Kinsey – The State of Fashion 2022

Clothing ranks fifth among the products where inflation is most pronounced. 44% of consumers are therefore reducing their spending in this segment—more than in any other product category except restaurants.
The most important influence on the procurement costs of clothing and footwear in the coming months will be rising transport costs (74%) and material costs (71%). However, transport capacities are also seen as a problem (69%).
E-commerce—The Share of Online Sales is Rising

E-commerce refers to the "commercial through a digital channel (B2C) sale of (men's, women's, and children's) apparel, footwear (e.g., leather shoes, sneakers, luxury shoes, and shoes made of textiles or other materials), suitcases and bags (e.g., suitcases, handbags, and briefcases), and accessories (e.g., hats and caps, watches, and jewelry)." (Statista)
Sales channels include, for example, general Internet retailers, online fashion retailers and specialist retailers. Not included, however, are retailers for outdoor and sports clothing or baby clothing, as well as second-hand portals.
Each user will spend an average of €366.20 in 2022 (€237.50 on clothing, €145.90 on accessories, €57.25 on shoes). At 28.1%, the penetration rate of users is highest for clothing purchases (shoes 27.3%, accessories 23.3%). In absolute terms, this translates into € 2.24 billion. (Clothing; 2,18 Bn. Shoes, 1,75 Bn. Accessories).
At 33.6%, one third of sales are generated via digital sales channels. Mobile devices account for 61.4% of this.
The global number of e-commerce users inside the fashion market in 2022 is 2.24 Bn. (apparel), 2.18 Bn. (footwear) and 1.75 Bn. (Accessories)
In 2022, apparel will account for the largest share of sales at €506.30 billion, followed by accessories at €259.10 billion. Shoes are in third place with €119.10bn.
The shopping cart abandonment rate is highest for luxury fashion at 87.78% (average for fashion: 84.43%).
Online retail sales figures in 2021 were 509.1 Bn. USD for apparel, 261.46 Bn. USD for accessories and 122, 15 Bn. USD for footwear. The forecast for 2025 sees growth to 785.66 Bn. USD (apparel), 395.41 Bn. USD (accessories) and 175.98 Bn. USD (footwear). The largest market is China, ahead of the USA.
Global online sales for fashion in 2021 were €754.10 Bn. The forecast for 2022 is €885.50bn. Annual sales growth of 10.14% is expected through 2025. At €279.10 Bn, the largest sales in 2022 will be generated in China, followed by the USA at €185.70.
The most successful Internet online store in terms of net sales in the apparel sector is jd.com ($14.5 billion), ahead of shein.com ($1.5 billion) and zara.com ($1.1 billion).
| Onlineshop | Annual sales / Bn. USD |
|---|---|
| jd.com | 14.50 |
| shein.com | 9.50 |
| zara.com | 7.10 |
Excluding general internet retailers, online retail accounts for a share of 20.8% of apparel retail worldwide. By continent, the share is highest in Asia at 39.7% (market volume $172.4 trillion) and lowest in Africa at 6.5% (market volume $1.56 trillion).
In May 2022, the most visited fashion and apparel website in the world was shein.com, which generated 3.4% of total traffic. The 2nd and 3rd places were taken by nike.com (2%) and hm.com (1.57%).
Second hand fashion

Second-hand fashion refers to all fashion items that are recycled second-hand. This can be done either by selling them, passing them on free of charge or, increasingly, via special rental models.
A survey in different countries of the world has shown that the purchase of second hand fashion is very different. While 66% of consumers in France and 51% in Poland have purchased second-hand products, the share in Russia was only 23% (2020 and 2021 respectively).
Statista Global Consumer Survey (GCS) and Statista

The market volume in the second-hand sector in 2021 was estimated at 96 Bn. USD. By 2026, the volume could more than double to 218 Bn. USD could be achieved. Thus, a 3x stronger market growth in the Second-Hand sector is forecast compared to the classic clothing market.
The largest growth of the second-hand market is forecast in North America until 2026. Here, the market could grow 8x faster than the traditional clothing market. In Europe, still twice as much.
Platforms that rent or sell clothing are enjoying growing popularity. In 2021, The RealReal generated global sales of $167 million here, followed by Poshmark with $126 million.
Annual Reports , 1 and 2
A comparatively new concept is that of shared apparel, which transfers business models such as marketplaces or rental services to the apparel market. This already generated 4.66 Bn. USD in 2021 and could grow to 7.45 Bn. USD. The Americas currently account for 53.4% of the global market, followed by Europe (27.1%).
Fashion and social media

Social media have long been an integral part of companies' marketing mix. Influencers in particular are becoming increasingly important.
The market volume of global influencer marketing in fashion was 1.5 Bn. USD. Between 2020 and 2027, an annual growth rate of 35.7% is forecast. With 39.7%, the market is dominated by nano-influencers.

The influencer marketing market has grown from 9.7 Bn. in 2020 to 13.8 Bn. USD in 2021.
At 6.3%, the fashion segment has the fourth-largest interaction figures on Facebook worldwide. On Instagram, the fashion industry is even in second place with 21.5 %.
The most successful profile on Instagram in the fashion sector is Dior, ahead of Gucci and Pretty Little Thing.
Compared to other sectors such as retail, beauty, automotive or electronics, the fashion industry recorded the most interactions on Instagram (Q4 2020). At 24%, almost every fourth like/post/share was related to fashion.
Socialbakers and Statista
The world's most successful fashion and beauty influencers on Instagram in 2020 were
| Influencer | Reach Followers in $ million | medial value per post in $ |
|---|---|---|
| Kylie Jenner | 181.2 | 906,270 |
| Kim Kardashian West | 175.5 | 851,682 |
| Kendall Jenner | 131.9 | 641,335 |
| Khloe Kardashian | 114 | 544,020 |
| Kourtney Kardashian | 94.6 | 444.519 |
The use of online reviews and ratings as a purchasing decision is widespread among 50% of shoppers in Indonesia—well above the global average of 27%. Danes use this method particularly rarely to support the purchase of fashion items (14%).
The potential of Facebook's Metaverse in the USA alone is estimated at 594 Bn. USD that users:inside could spend.
Luxury fashion in social media

As a source of information for luxury brands in the fashion sector, social media play a very different role worldwide: While the networks are used by 65% of consumers in China, only 24% of Italian consumers use social media.
The most popular luxury brand among online users is Dior, ahead of Gucci and Louis Vuitton. The value is measured on the basis of Google search volume, organic and paid traffic, and reach and engagement in social networks.
In terms of YouTube channels, Chanel is the luxury brand with 2 million subscribers, ahead of Dior, which had 1.52 million followers in July 2022. In terms of average views per video, Louis Vuitton with 1.36 million views is ahead of Prada with 452,370. Chanel, on the other hand, records only 13,870 and Dior 31,040 views per video.
Sustainability in the fashion industry

Alongside digitization, sustainability is one of the most important megatrends of the 21st century. After all, it is an indispensable prerequisite for achieving climate targets. It's no wonder that fashion companies are also increasingly addressing the issue.
Although "ethical fashion" is difficult to define—it is commonly understood to mean fair trade and sustainable fashion that does not involve exploitation in the supply chain—one statistic subsumes the market volume of 7.65 Bn. USD in 2022, which is expected to grow to 10.11 Bn. USD by 2025.
The Business Research Company and Statista
24% of companies intend to manufacture at least half of their products from recycled materials by 2025.
Consumer behavior

50% of buyers are aware of the negative impact of fast fashion on the environment. 59% of buyers state that it is difficult to change the habit.
Copenhagen is the most environmentally friendly city for fashion in Europe in terms of textile waste produced. Antwerp and Dublin come in second and third place.
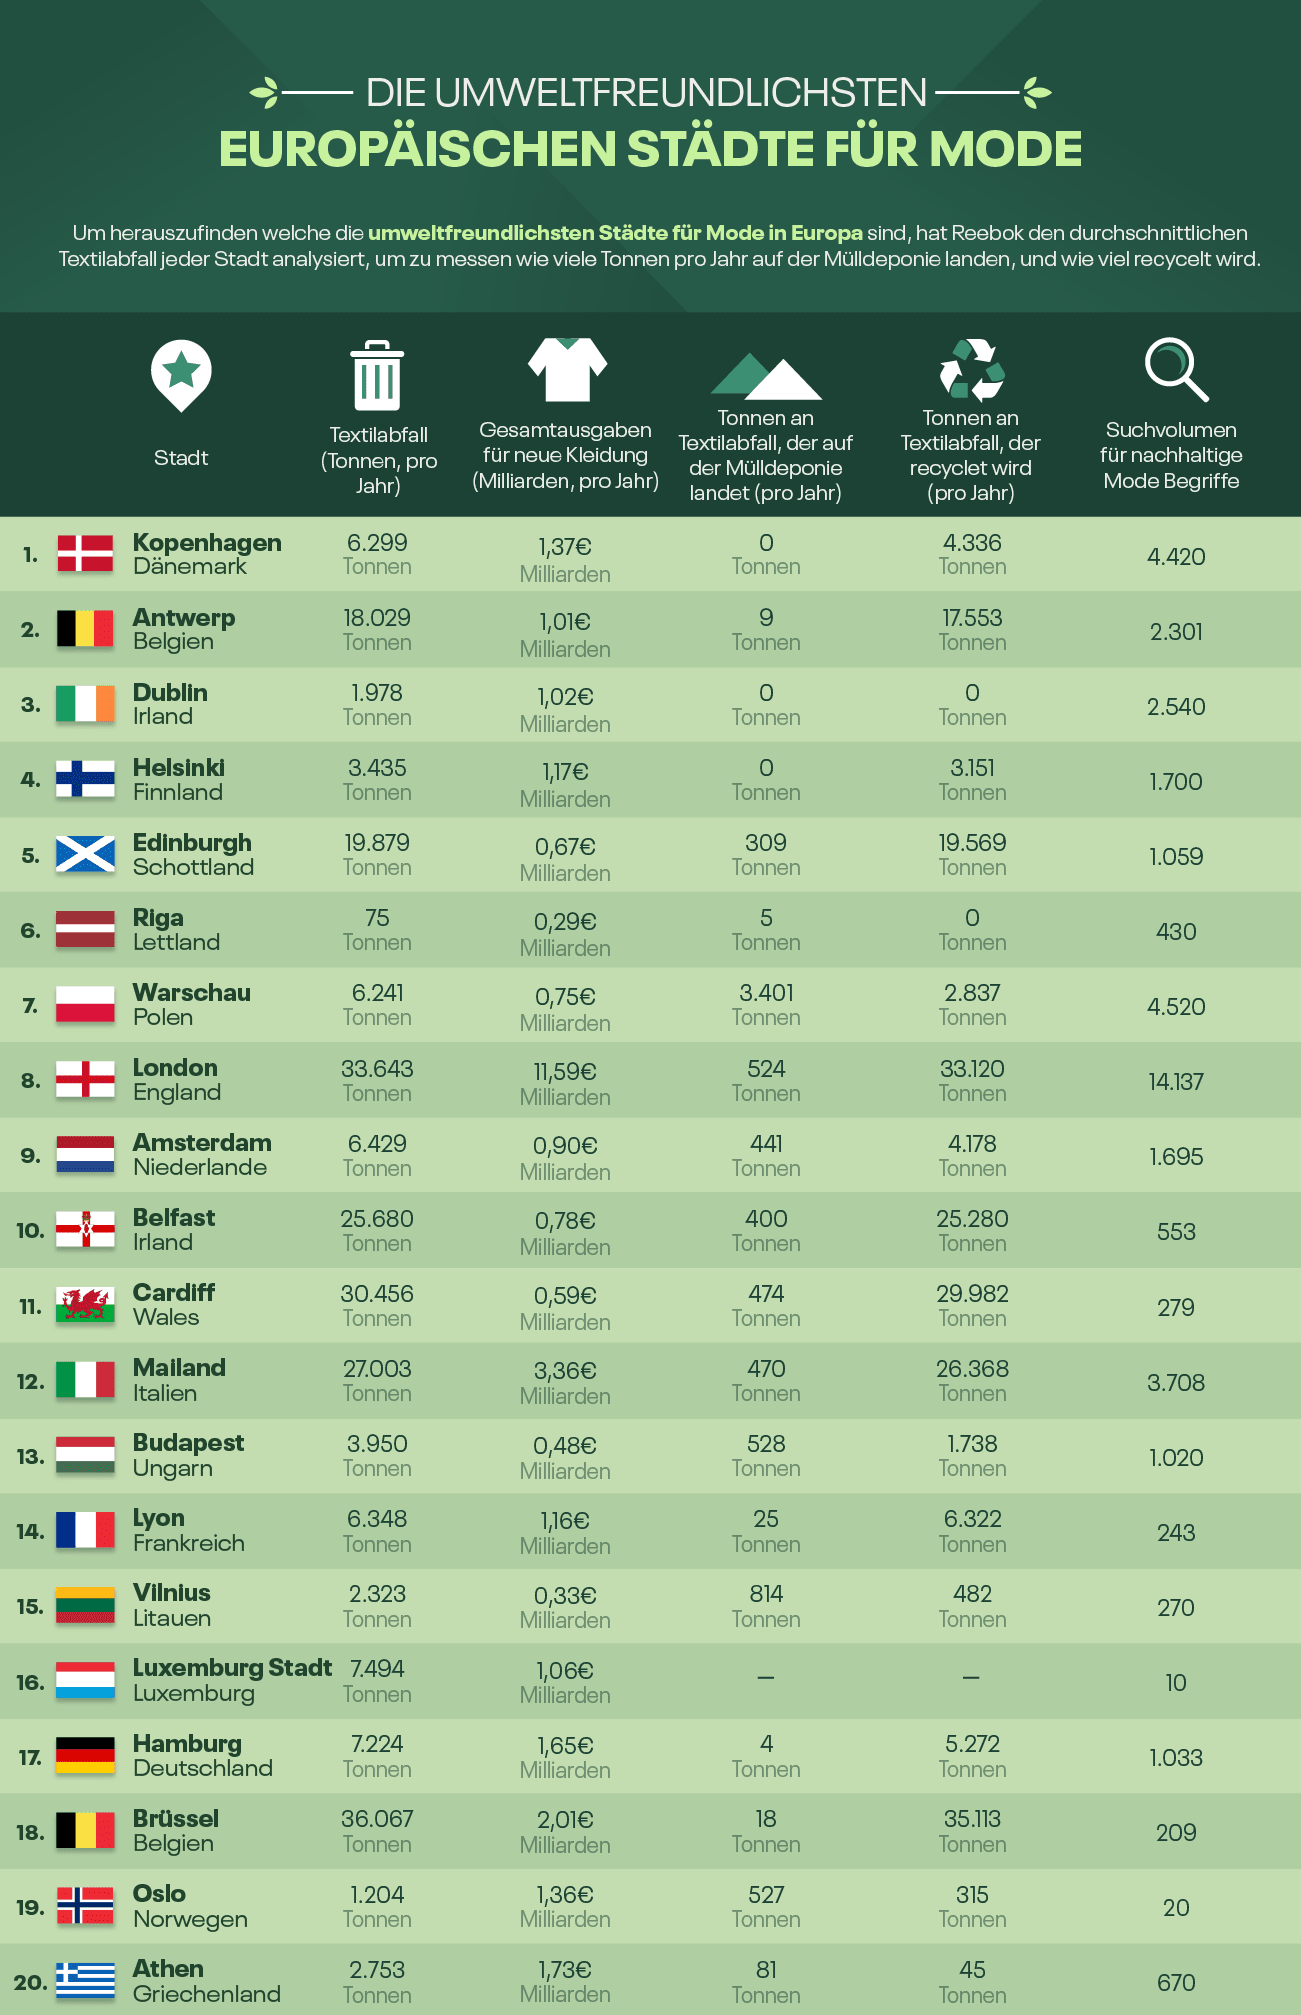
The fashion brand OVS was named the world's most transparent brand in 2022. It achieved a score of 78%.
34.3% of respondents to a survey conducted by YouGov on behalf of Changing Markets buy certified apparel at least frequently, while 44.4% rarely to never do so.
According to a survey conducted by YouGov on behalf of Changing Markets, only 38.4% of consumers in selected countries (France, Germany, Spain, the UK and the USA) trust the sustainability claims made by fashion brands. 46.8% disagree with this statement.
Resource consumption of the fashion industry

The fashion industry is considered one of the most resource-intensive and thus environmentally damaging industries in the world, not least because of fast fashion. From both an ecological and a social perspective, the statistics speak for themselves.
The annual resource input for the apparel industry (2015).:
98 tons of crude oil
1,458 tons Greenhouse emissions
92 million tons of waste
60 million textile workers
27 million textile workers with work-related diseases
43 million tons of chemicals
79 million cubic meters of water
522 million kg of microfibers in the oceans
5% of cultivated land worldwide for fiber and material production
7% of municipal urban waste is generated by fashion consumption.
93 % of the textile companies surveyed do not pay their workers a living wage. Unlike the minimum wage, the living wage, recognized by the United Nations as a human right, is "a wage sufficient to provide workers and their families with an adequate standard of living." It must cover food, water, shelter, education, health care, transportation and clothing. In addition, a small portion of the wage should be at the worker's free disposal.
52% of the materials processed for clothing worldwide are polyester. Cotton accounts for the second-largest share at 24.2%.
Statista (only with subscription)

Around 140 producers and companies are involved in the manufacture of a white dress shirt worldwide, from the production of the raw materials to the sale in the clothing store.
It takes up to 15,000 liters of water (2,700 liters on average) to produce one kilogram of cotton. It takes one kilo of raw cotton and about one kilo of environmentally harmful chemicals, which in turn contribute to water pollution, to make one T-shirt.
80% of the approximately 60 million people employed in the garment industry worldwide are women, who are often paid less than their male counterparts and are more likely to be subjected to verbal, physical and sexual violence.
In 2020, the apparel industry was responsible for 10% of global CO2 emissions and was considered the second largest consumer of freshwater supplies in the world. It is held responsible for 20% of industrial water pollution worldwide.
Washing processes release around 500,000 metric tons of microparticles into the sea every year. This corresponds to around 50 Bn. plastic bottles. The International Union for Conservation of Nature (IUCN) estimated in 2017 that around 35% of all microplastics in the sea originate from washing synthetic materials.
Every second, 1 truckload of clothing is burned or disposed of (2,625 kg). Every day, the Empire State Building could be filled with this 1.5 times. That's enough to fill the entire Sydney Harbor annually (82.78 million kg) (2019).
Greenhouse gas emissions from the apparel industry have steadily increased since 2019 and currently stand at 1.155 megatons. Emissions are forecast to reach 1.588 megatons in 2030.
Bangladesh is considered to be the most important sourcing country for apparel by 2025. 61% of the purchasing managers of international apparel and sporting goods manufacturers surveyed name the country as one of the three most important sourcing markets, along with Vietnam and Turkey (34% each).
Factories pay the lowest wages to seamstresses in 2018 at $16 per month in Ethiopia, followed by Myanmar and Bangladesh at $15 / month each.
At 59%, more than half of a T-shirt remains with the retailer. The brand receives a further 12%. The material also accounts for 12%, transport for 8%, and intermediaries for 5%. The factory in the country of manufacture receives around 4% of the sales price, and 0.9% are fixed costs. Wages for workers account for only 0.6% of the selling price (the calculation is based on a selling price of €29).
Fast Fashion

The business model of fast fashion is characterized by a rapid succession of collections that are designed, produced and sold in a short time. Characteristic of this are the low prices, which are often accompanied by poor working conditions in low-wage countries and resource-intensive production methods in global supply chains.
The number of collections offered annually by fast fashion providers has multiplied since 2000. Whereas an average of 2 collections were offered annually throughout Europe, frontrunners such as H&M have 12-16, and Zara even 24 in some cases.
The market volume of fast fashion in 2021 was 91.23 Bn. USD. By 2026, it is forecast to grow to 133.34 Bn. USD is forecast. This means an annual growth rate of 7.7% on average.

The world's largest fast fashion groups Inditex, H&M and Fast Retailing could increase their sales from 2020 to 2021, in some cases significantly:
| Company | 2020 / Bn. € | 2021 / Bn. € |
|---|---|---|
| Inditex | 20.4 | 27.72 |
| H&M | 18.36 | 19.41 |
| Fast Retailing | 15.95 | 16.42 |
Vegan fashion

The growing awareness of a sustainable and healthy lifestyle among consumers also affects the production of fashion. This applies in particular to the use of leather and fur, to the production of which a counterpart has developed in the form of vegan fashion, which completely avoids using animal-based materials.
The estimated market value of the vegan fashion market in 2021 is 460 Bn. USD and is expected to grow to 1.12 trillion USD by 2028.
Awareness of animal welfare among consumers is highest in Switzerland with 84%, followed by Austria with 83%. These two countries are also ahead when it comes to prioritizing another brand based on animal welfare (Austria 53%, Switzerland 49%). Most consumers who completely avoid buying animal-based fashion live in Bulgaria (28%).
Statista (only with subscription)

The world's largest sales market for faux fur is clearly the USA. Here, revenues of around 7.6 million US were generated. The second largest market—the United Kingdom with 1.48 Bn. USD—lags well behind. At 0.07, the per capita purchase rate is equally high in Europe and the Americas.
Global sales of artificial leather are expected to increase from 41.32 Bn. USA in 2022 to 49.02 Bn. USD in 2025. In this context, the current highest sales are in the Netherlands with 0.71 articles per capita (average worldwide: 0.46). In terms of sales figures, the USA with 14.36 Bn. USD, ahead of the United Kingdom with 2.02 Bn. USD.
The market for vegan footwear, which does not use leather or other animal products in its production, could grow from 13.03 Bn. USD in 2020 to 32.05 Bn. USD. This amounts to an annual growth rate of 11.3%. The most widespread sales in this regard are through specialty stores.